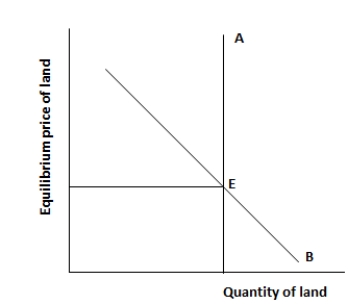
The figure given below represents an imperfectly competitive resource market. Here common land (and not land used for specific purpose) is under consideration.Figure 18.1

-An increase in economic rent is accompanied by an increase in the quantity supplied of a resource.
Definitions:
Scatter Diagram
A graph that shows the relationship between two variables by displaying data points on a two-dimensional plane.
Mortgage Rate
The interest rate charged on a mortgage loan.
Number of Houses Sold
A real estate metric that refers to the total count of residential dwellings sold during a specific time period.
Correlation
A statistical measure that describes the extent to which two variables change together.
Q4: Lobbying efforts by individuals and firms:<br>A)increase productive
Q7: If the ratio of marginal revenue product
Q45: Investment in human capital implies:<br>A)investment on machines,technological
Q55: Income inequality is indicated by a Lorenz
Q58: A market is said to be concentrated
Q58: In 1992 the EEC was replaced by
Q73: Which of the following can result in
Q76: If the tax rate increases with increase
Q91: In Figure 13.4,if the government sells Q<sub>b
Q98: According to Figure 21.1,the tariff revenue earned