The figure given below shows the demand curves (D1 and D2) and supply curves (S1 and S2) of labor in the labor market. Figure: 15.2 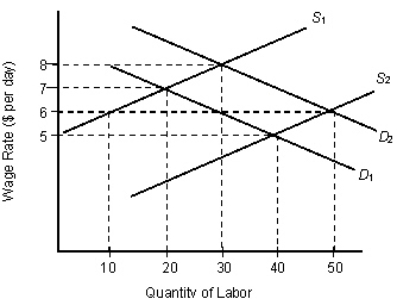
- In Figure 15.2,the initial labor supply is S1 ,and the labor demand is D1.If the wage is $6,which of the following is correct?
Definitions:
Q3: On account of a massive construction boom
Q10: According to the Coase theorem,high transaction costs
Q16: Gini co-efficient is the:<br>A)area between the Lorenz
Q24: Privatization occurs when a state owned firm
Q32: Minimum wage legislation by the government would:<br>A)create
Q63: The social security system in the United
Q77: When studying the market for resources,it is
Q84: Assume that labor is the only variable
Q94: In order to induce risk averse people
Q112: Why are a large number of IT