The figures given below show the demand (D) and supply (S) curves of labor in two different markets. Figure 15.3 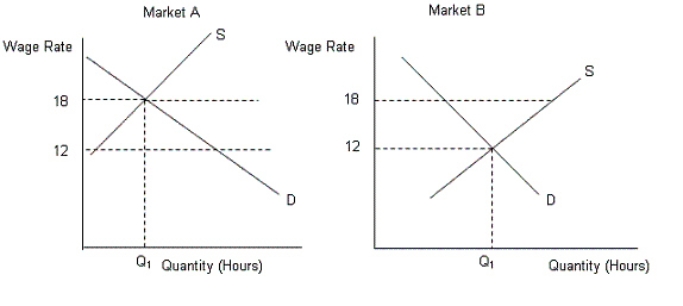
- Refer to Figure 15.3.If the wage rates in market A and market B were set at $20,then:
Definitions:
Intangible Assets
Non-physical assets that possess value due to their intellectual or non-material nature, such as patents, trademarks, and goodwill.
Depreciation Method
A systematic approach used to allocate the depreciable amount of an asset over its useful life, such as straight-line or declining balance methods.
Depletion
The systematic allocation of the cost of natural resources over the period of their extraction and sale.
Natural Resource
Materials or substances such as minerals, forests, water, and fertile land that occur in nature and can be used for economic gain.
Q2: Like profit-seeking,rent seeking is also a productive
Q18: A Gini of 0 implies:<br>A)every family has
Q29: According to Figure 20.2,the international equilibrium
Q32: A perfectly competitive firm hires more resources
Q48: According to Figure 18.3,given the existing demand
Q49: As per the payment system laid down
Q60: Refer to Figure 15.5.If a minimum wage
Q71: The demand for unskilled workers is highly
Q74: If the Gini coefficient for the United
Q112: Refer to Table 20.3.Determine the limits