The figures given below show the demand (D) and supply (S) curves of labor in two different markets. Figure 15.3 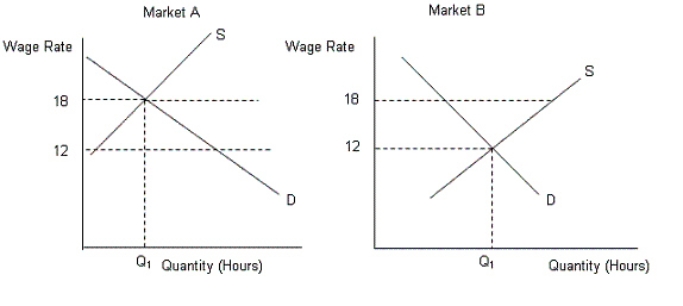
- Refer to Figure 15.3.If the wage rates in market A and market B were set at $20,then:
Definitions:
Covariance
A measure of how two random variables change together, indicating the direction of their linear relationship (positive, negative, or zero).
Coefficient of Correlation
A statistical measure that calculates the strength and direction of the relationship between two variables, ranging from -1 to 1.
Interquartile Range
A measure of variability based on dividing a data set into quartiles; it represents the range between the first and third quartile, excluding outliers.
Uninsured Retirees
Individuals who have retired and do not have insurance coverage, potentially facing risks related to healthcare costs.
Q13: The labor demand curve is based on
Q13: If social regulation increases a firm's fixed
Q17: Advertising,brand names,packaging,and celebrity endorsements all occur in
Q23: In the market for both renewable and
Q49: In Figure 17.1,the curve B indicates:<br>A)supply
Q51: The principal argument against comparable worth is
Q55: Income inequality is indicated by a Lorenz
Q55: The price of a resource declines when:<br>A)both
Q90: In Figure 16.1,if the initial demand
Q91: Bonds and stocks act as complementary goods