The following figures show the demand and supply of labor in two different types of labor market. Figure 15.5 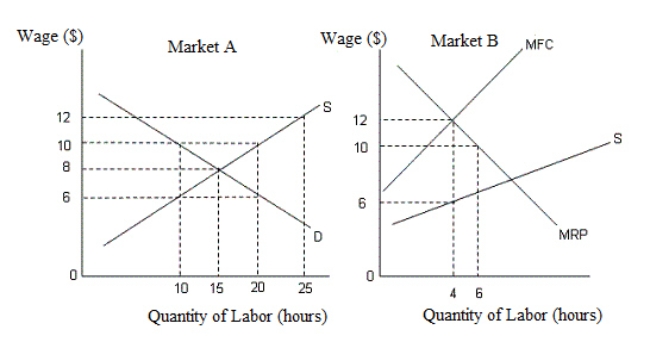 In the figures,
D: Demand curve for labor
S: Supply curve of labor
MRP: Marginal revenue product
MFC: Marginal factor cost
-In Figure 15.5,the equilibrium wage rate and the level of employment in Market A are _____ and _____ respectively.
Definitions:
Healthy Living
A lifestyle that includes balanced nutrition, regular physical activity, and avoidance of unhealthy behaviors such as smoking.
Sales Tax
A tax imposed by the government on the sale of goods and services.
Labor Market
The labor market is the marketplace where employers find workers and workers find jobs, dictated by supply and demand for labor.
Market Wage Rate
The prevailing rate of pay for a specific job in a given labor market.
Q11: The resource market is the same as
Q25: Production becomes more efficient if a common
Q27: A stock index measures the:<br>A)change in dividend
Q37: The system of adjusting social security benefits
Q79: Income distribution across the world is highly
Q85: The Dutch Disease had occurred in Netherlands
Q93: If everyone had the same income,then the
Q94: Strategic interdependence occurs in:<br>A)perfect competition.<br>B)monopoly.<br>C)monopolistic competition.<br>D)oligopoly.<br>E)local monopoly.
Q105: The quantity of labor supplied by a
Q114: People leave their home country and go