The figure given below represents equilibrium in the labor market. Figure 14.5 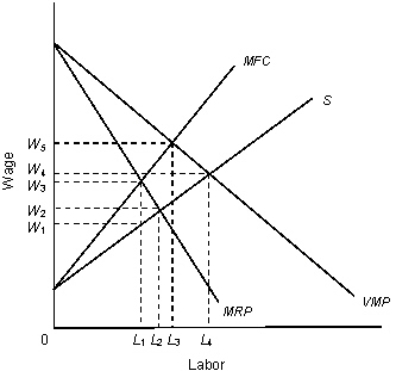 In the figure,
VMP: Value of marginal product curve
MRP: Marginal revenue product curve
MFC: Marginal factor cost
S: Supply curve of labor
In Figure 14.5,the firm is:
Definitions:
Target Pricing
A pricing method in which the selling price of a product is calculated to produce a particular return on investment for a specific volume of production.
Bundle Pricing
A marketing strategy where multiple products or services are packaged together and sold at a single price, often for a discount.
Penetration
A measure of the extent to which a product, service, or brand has been adopted by customers within a particular market.
Standard Markup
A conventional percentage added to the cost price of goods to determine their selling price.
Q2: A firm employing secretaries and steelworkers should
Q12: Why do skilled workers earn relatively higher
Q15: Under the negative income tax program,a family
Q25: Empirical evidence suggests that the aging of
Q37: What are the earnings of a resource
Q47: In contrast to perfect competition,in a monopolistically
Q49: If an individual who earns $20,000 pays
Q51: The following table shows the total output
Q55: When the benefits of an activity are
Q84: A market in which adverse selection may