The figure given below represents equilibrium in the labor market with the demand and supply curves of labor. Figure 14.6 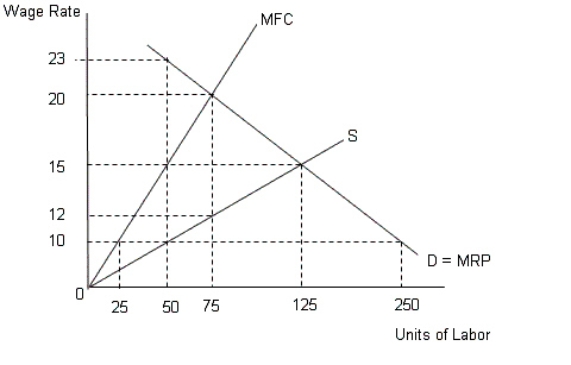 In the figure,
D = MRP implies demand for labor = Marginal Revenue Product
MFC represents Marginal Factor Cost curve
S represents the supply curve of labor
According to Figure 14.6,what is the wage paid by a monopsonist?
Definitions:
Labor Productivity
refers to the amount of goods and services produced by one hour of labor.
Developing Nations
Countries that are in the process of industrialization and have lower levels of material well-being compared to developed economies.
Privately Controlled
refers to entities or businesses that are owned, operated, and managed by private individuals or corporations rather than by the government.
Economic Growth
The increase in the inflation-adjusted market value of the goods and services produced by an economy over time.
Q14: The ratio of workers to social security
Q19: The supply of hydro electric power:<br>A)can be
Q25: A firm that was initially a monopsonist
Q57: The more inelastic the supply of a
Q60: If the market price of the product
Q65: Dividend yield is:<br>A)the annual dividend payment per
Q67: The good for which neither the principle
Q81: Because of illegal immigrants,the equilibrium wage rate
Q89: Refer to Figure 12.1.The natural monopolist will
Q113: Consider the monopolist described in Figure 10.3.If