The figure below shows the demand and supply curves in the market for elementary education. Figure 13.1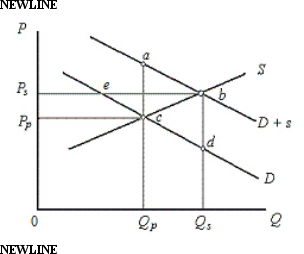 In the figure,
D: Private demand curve for elementary education
D + s: Demand curve which includes public benefits
S: Supply curve of education
Price and Quantity have been taken on vertical and horizontal axes respectively.
-Figure 13.1 represents a situation of:
Definitions:
Q6: The following table shows the total output
Q17: Which of the following has led to
Q38: When a good is subsidized by the
Q50: The equity market is said to be
Q55: To avoid driving a natural monopolist into
Q61: In Figure 18.5,the equilibrium quantity of human
Q63: As a firm in a monopolistically competitive
Q72: Disparate treatment refers to:<br>A)the treatment of individuals
Q81: In Figure 9.3,the firm will have
Q84: Successful product differentiation by a monopolistically competitive