The figure below shows the demand and supply curves in the market for elementary education. Figure 13.1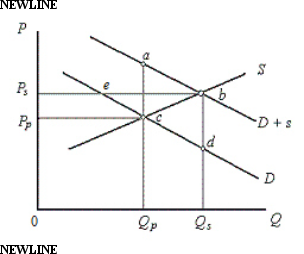 In the figure,
D: Private demand curve for elementary education
D + s: Demand curve which includes public benefits
S: Supply curve of education
Price and Quantity have been taken on vertical and horizontal axes respectively.
-In Figure 13.1,D represents the private demand for education,and D+s represents the demand including the public benefits of education.According to the figure,the optimal subsidy is equal to:
Definitions:
Duty of Loyalty
A legal obligation of an individual to act in the best interests of another party or entity, often in a fiduciary capacity.
Flooring
In retail, it refers to the financing or loan provided to cover the cost of inventory; in construction, it pertains to the material used to construct floors.
Installs
The process of setting up software or hardware for it to be ready for use in a computer system.
Principal and Agent
A relationship where the principal grants authority to the agent to act on the principal’s behalf in dealing with third parties.
Q21: If government-assured medical and other benefits increase
Q35: If coal is extracted in an unsustainable
Q55: Which of the following is a consequence
Q61: Often the best way for a firm
Q63: Under price discrimination,a monopolist equates the marginal
Q73: Firms develop brand names in order to
Q78: Which of the following factors affects the
Q87: The first phase of antitrust policy in
Q87: Firms that have downward-sloping demand curves:<br>A)earn positive
Q94: Strategic interdependence occurs in:<br>A)perfect competition.<br>B)monopoly.<br>C)monopolistic competition.<br>D)oligopoly.<br>E)local monopoly.