The figure given below shows the demand for permits and the maximum permissible level of pollution. Figure 13.4 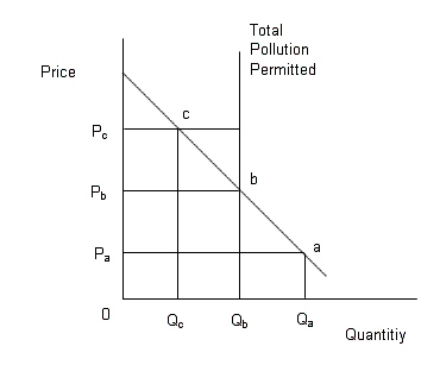 In the figure,
The downward sloping line is the demand curve of permits;
The vertical line denotes the maximum permissible limit of pollution.
-Refer to Figure 13.4.Suppose the government wishes to reduce pollution to a quantity of Qb.If it sells marketable pollution permits at a quantity of Qb then:
Definitions:
Average Revenue
The amount of revenue received per unit of a good or service sold, calculated by dividing total revenue by the total number of units sold.
Maximize Profits
Business objective to achieve the highest possible profit from operations and sales.
Minimize Losses
A strategy aimed at reducing the negative impacts or financial losses in operations, investments, or other activities.
Market Price
The current price at which a good or service can be bought or sold in a marketplace, determined through the supply and demand dynamics.
Q25: A firm that was initially a monopsonist
Q39: Common ownership of resources:<br>A)is a system by
Q47: Why do market failures arise in case
Q51: Movie theaters are able to offer discounts
Q53: Under the long-run equilibrium for perfectly competitive
Q63: Bills introduced in the United States in
Q84: Which of the following has resulted from
Q96: Refer to Figure 15.2.At the initial
Q129: In the short run a firm continues
Q135: In Figure 9.3,the profit maximizing output