The figure below shows revenue and cost curves of a natural monopoly firm. Figure 12.1 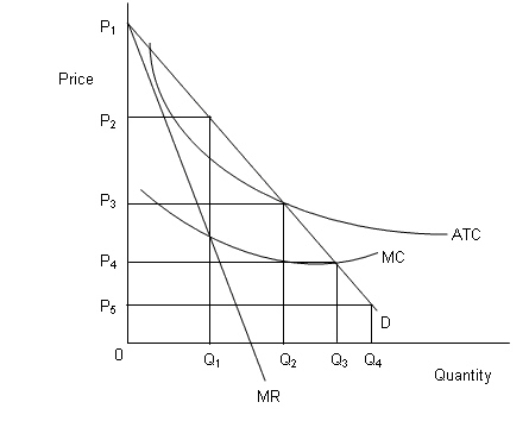 In the figure,
D: Demand curve
MR: Marginal revenue curve
MC: Marginal cost curve
ATC: Average total cost curve
-Refer to Figure 12.1.Identify the fair-rate-of-return price.
Definitions:
Motivation
The internal and external factors that stimulate desire and energy in people to be continually interested and committed to a job or subject.
Suboptimal Decision
A choice made that is not the best or most effective among the alternatives considered.
Transfer Pricing
The setting of prices for transactions between affiliated companies within the same multinational group, which can impact where profits are reported.
Market-Based
Pricing or decision-making strategies that are influenced primarily by market conditions and customer demand rather than internal cost considerations.
Q19: Which of the following faces a horizontal
Q23: Economists like Joseph Stiglitz regard market as:<br>A)an
Q23: When firms use cost-plus pricing in a
Q58: A market is said to be concentrated
Q68: Offshoring does not affect the percentage of
Q70: In an antitrust lawsuit,which of the following
Q79: One necessary step in demonstrating monopolistic behavior
Q86: Economic theory suggests that the consumer-prejudice explanation
Q94: The following table shows the marginal productivity
Q100: The free-rider problem occurs because:<br>A)it is easy