In the following figure,the first panel shows a market situation prior to regulation and the second panel shows the effects of regulation. Figure 12.2 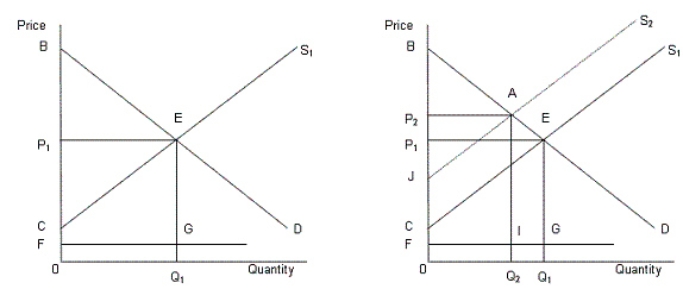 In the figure,
D: Demand curve for automobiles
S1: Supply curve of automobiles prior to regulation
S2: Supply curve of automobiles after regulation
FG: Clean up cost per unit
-According to Figure 12.2,the total clean up cost after the regulation is:
Definitions:
Q6: The following table shows the total output
Q10: Which of the following are the three
Q10: Why does a monopolist face the market
Q17: If a particular factor has a specific
Q42: Why was trucking deregulated in the U.S.in
Q53: If resource A and resource B are
Q85: The following table shows output per hour
Q96: Compute the actual investment in a mutual
Q97: In a price-leadership oligopoly model,the oligopoly firms
Q112: The opportunity cost of capital is:<br>A)the cost