The figure below shows revenue and cost curves of a natural monopoly firm. Figure 12.1 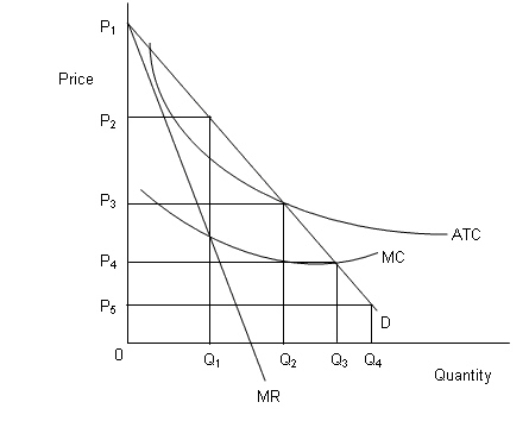 In the figure,
D: Demand curve
MR: Marginal revenue curve
MC: Marginal cost curve
ATC: Average total cost curve
-Refer to Figure 12.1.Identify the fair-rate-of-return price.
Definitions:
Program Results
The outcomes or impacts of a project or program, often used as a measure of its effectiveness.
Health Benefit
Refers to the positive effects on health and well-being provided by certain actions, policies, or products, including medical insurance coverage provided by employers or governments.
Fixed Expense
Costs or expenses that remain constant for a period of time regardless of changes in business activity levels, such as rent or salaries.
Net Assets
The total value of an organization's assets minus its total liabilities, representing the organization's financial health.
Q1: In Table 8.2,assume that Holmes's total fixed
Q1: Refer to Scenario 14.1.If the worker joins
Q25: Airlines can increase profits by charging higher
Q49: Why is the market supply curve of
Q65: According to Table 10.1,what is the marginal
Q72: One reason that monopolistically competitive firms often
Q94: Quickie Inc.,a perfectly competitive firm,currently maximizes profit
Q102: Statistical discrimination is legal under the disparate
Q102: A price discriminating monopolist charges a very
Q109: The figure given below shows the revenue