In the following figure,the first panel shows a market situation prior to regulation and the second panel shows the effects of regulation. Figure 12.2 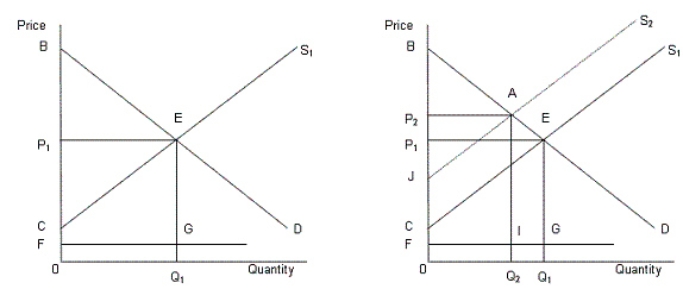 In the figure,
D: Demand curve for automobiles
S1: Supply curve of automobiles prior to regulation
S2: Supply curve of automobiles after regulation
FG: Clean up cost per unit
-According to Figure 12.2,the total clean up cost after the regulation is:
Definitions:
Withdrawals
The act of taking out cash or other assets from a business by the owner for personal use.
Investments
Financial assets purchased with the expectation they will generate income or appreciate in the future.
Balance Sheet
The balance sheet is a financial statement that reports a company's assets, liabilities, and shareholders' equity at a specific point in time, providing a snapshot of its financial condition.
Telephone Expense
This represents the cost associated with telephone usage and services for a business, classified as an office expense.
Q13: In Table 8.1,the marginal revenue from
Q37: When the government imposes a tax on
Q41: If the market price of oats is
Q47: Consider a market consisting of seven firms
Q53: Under the long-run equilibrium for perfectly competitive
Q58: The following figure shows the marginal revenue
Q67: The figure given below shows the demand
Q96: The demand curve for labor indicates that:<br>A)as
Q114: People leave their home country and go
Q121: Graphically,consumer surplus is the area:<br>A)above the equilibrium