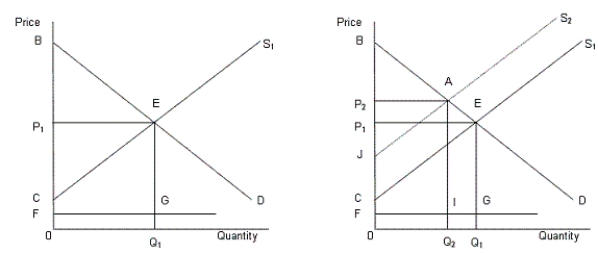
In the following figure, the first panel shows a market situation prior to regulation and the second panel shows the effects of regulation.Figure 14.2
 In the figure,
D: Demand curve for automobiles
S1: Supply curve of automobiles prior to regulation
S2: Supply curve of automobiles after regulation
FG: Clean up cost per unit
-Actions against alleged violators of the antitrust statutes may be initiated by the Justice Department, by the Federal Trade Commission, and by private plaintiffs.
Definitions:
Consignment
A process where goods are sent by their owner to an agent for the purpose of sale, storage, or shipment.
FOB Destination
A shipping term indicating that the seller bears all costs and risks until the goods are delivered to the buyer's location.
Weighted Average
A calculation that takes into account the varying degrees of importance of the numbers in a data set, giving weight to some data points more than others.
Gross Profit
The financial metric calculated by subtracting the cost of goods sold from total sales revenue.
Q14: According to Figure 12.2,the total societal surplus
Q21: Most natural monopolies are regulated at some
Q22: A local monopoly is a firm that:<br>A)is
Q42: Grocery coupons and mail-in rebates are forms
Q52: If a resource has perfectly elastic supply
Q63: In general,the two extreme cases of market
Q75: The figure given below represents equilibrium in
Q101: If the marginal factor cost is greater
Q107: According to the information in Scenario 8.2,how
Q116: If the value of a network to