The figure below shows the revenue and cost curves of a monopolistically competitive firm. Figure: 11.2 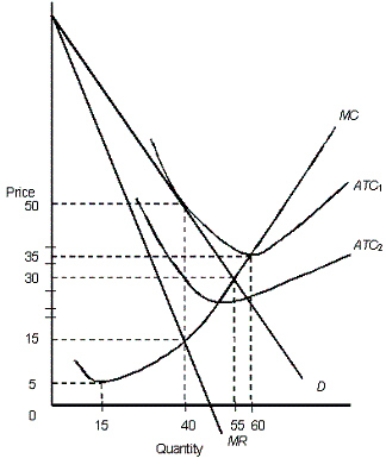 In the figure,
D: Demand curve
MR: Marginal revenue curve
ATC1 and ATC2: Average total cost curves
MC: Marginal cost curve
-In Figure 11.2,if the market is monopolistically competitive,which quantity represents long-run equilibrium for the firm?
Definitions:
Principles
Fundamental truths or propositions that serve as the foundation for a system of belief, behavior, or reasoning.
Goal-Sharing
A strategy where organizational objectives are communicated and shared among team members to ensure alignment and foster cooperation.
Gain-Sharing
A performance-based compensation strategy where employees receive benefits from the cost-saving measures they contribute to.
Draw System
A compensation method where payments made to an employee in advance are later subtracted from their commissions to ensure they receive a consistent income.
Q6: The following table shows the total output
Q34: A firm will demand more units of
Q34: If economic losses exist in a monopolistically
Q36: Profit of a firm is maximized when:<br>A)marginal
Q54: If the tax rate increases with an
Q80: A firm will shut down permanently if
Q88: When a price rise of an asset
Q95: Assume that a firm's marginal revenue curve
Q99: The following figure represents the equilibrium in
Q109: Suppose a tax rate of 10 percent