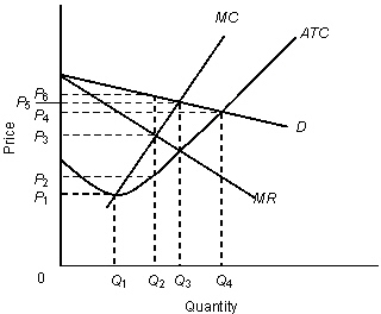
The figure given below shows the revenue and cost curves of a monopolistically competitive firm. Figure: 11.3  In the figure,
D: Demand curve
MR: Marginal revenue curve
MC: Marginal cost curve
ATC: Average total cost curve
-The monopolistically competitive firm in Figure 11.3 will maximize profits (or minimize losses) by producing _____ and charging _____.
Definitions:
Contractual Forms
denotes the various arrangements and agreements under which businesses and individuals engage in transactions, outlining the terms and conditions of their exchanges.
Average Variable Cost
The total variable cost divided by the quantity of output produced, representing the variable cost per unit of output.
Average Fixed Cost
The fixed costs of production divided by the quantity of output produced, which decreases as production increases.
Long Run
The long run is a period in which all inputs and production technologies can be varied, with no fixed factors of production.
Q1: In Figure 15.6,if the income constraint of
Q5: One cause of market failure may be
Q7: In a perfectly competitive industry,the price of
Q30: When a monopoly is regulated it is
Q62: When a divergence between social costs and
Q73: Which of the following is not a
Q108: Strategic behavior occurs when:<br>A)there are a large
Q111: Under perfect competition,at the profit maximizing level
Q111: Suppose the current price of a marketable
Q117: Which of the following is an impact