The following figures show the demand and cost curves of a perfectly competitive and a monopoly firm respectively. Figure 10.7 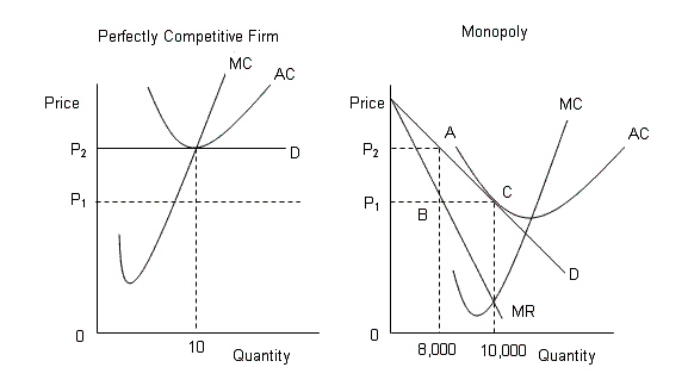
D: Average Revenue
AC: Average cost
MC: Marginal cost
MR: Marginal cost
-According to Figure 10.7,which of the following statements is incorrect about the price P1?
Definitions:
Solicit Capital
The act of requesting funding or investment from individuals or organizations, typically for business operations or projects.
General Supply
Refers to the overall provision or stock of resources, goods, or equipment that is available for use.
Managed by Shareholders
An organizational structure in which the owners (shareholders) of a firm take an active role in the management decisions.
Legal Entity
An organization or business that has legal rights and obligations, including the ability to enter into contracts and sue or be sued.
Q1: In Table 13.1,what level of tax per
Q9: Although the GATT was supported by most
Q21: Refer to Figure 9.2.If the marginal-revenue curve
Q38: If there is imperfect competition in the
Q40: Under long-run equilibrium in perfect competition,each firm
Q41: If marginal product increases with an increase
Q65: According to Figure 13.1,the outcome of an
Q73: Refer to Figure 9.7 and calculate
Q90: Consumers are willing to pay a higher
Q120: According to Figure 9.2,the break-even price of