Multiple Choice
The figures given below represent the revenue curves of a monopolist. Figure 10.2 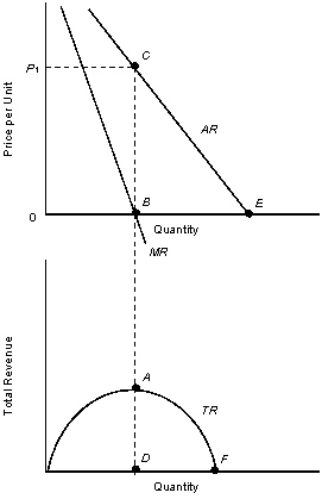
TR: Total revenue curve
AR: Average revenue curve
MR: Marginal revenue curve
-According to Figure 10.2,at point C:
Definitions:
Related Questions
Q10: A deadweight loss arises under perfect competition.
Q12: If the firm described in Table
Q32: In Figure 9.3,at equilibrium,the firm enjoys
Q48: A producer can raise profit by expanding
Q67: When the government borrows by having the
Q68: Which of the following characteristics distinguishes oligopoly
Q73: Which one of the following is based
Q83: In the long run,a perfectly competitive firm
Q89: In the figure,<br>|: Marginal cost curve<br>||:
Q92: If a firm experiences constant returns to