The figure given below shows the demand curves of two classes of buyers for tickets to a football match. Figure 10.4 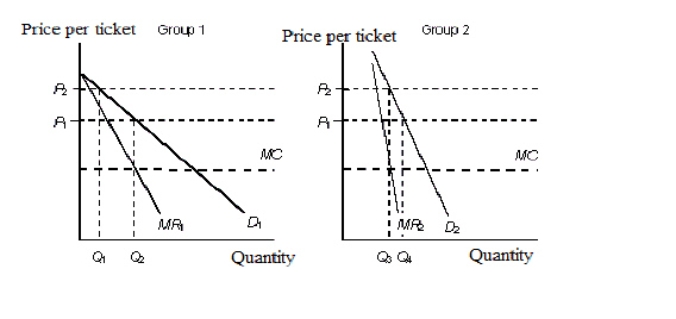
D1: Demand curve of group 1
D2: Demand curve of group 2
MR1: Marginal revenue of group 1
MR2: Marginal revenue of group 2
MC: Marginal cost
-Refer to Figure 10.4.What price must be charged to both the groups to maximize profits?
Definitions:
Unregulated Monopoly
A market condition where a single company or entity exclusively controls a particular industry or service without any governmental restrictions or oversight.
Pure Competition
A market structure characterized by a large number of small firms producing an identical product in an industry (market area) that permits complete freedom of entry and exit. Also called price-taker markets.
Efficient Allocation
The process of distributing resources in a way that maximizes the net benefit received from their use.
Monopoly Power
The ability of a company or group to control the market for its product or service, thus limiting competition.
Q2: For a perfectly competitive firm the break-even
Q9: Households' expenditure on goods and services are
Q24: Suppose the American Medical Association has been
Q33: According to Table 11.1,if both the
Q70: According to Figure 11.1,the profit-maximizing firm is
Q72: A firm's total revenue is $400 for
Q73: Which one of the following is based
Q86: Monopolistic competition is similar to perfect competition
Q94: A perfectly competitive firm cannot affect the
Q138: Mr.Max is about to purchase 4 units