The following figures show the demand and cost curves of a perfectly competitive and a monopoly firm respectively. Figure 10.7 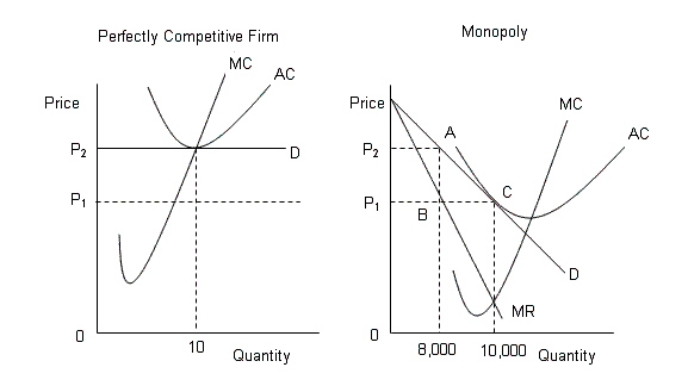
D: Average Revenue
AC: Average cost
MC: Marginal cost
MR: Marginal cost
-Calculate the deadweight loss in Figure 10.7,if the perfectly competitive industry is monopolized after it had been producing an output of 10,000 units?
Definitions:
Operating Activities
Activities directly related to the business's primary operations, including cash flows from sales, expenses, and cost of goods sold.
Total Assets
The total of a company's assets, encompassing both short-term and long-term assets.
Direct Method
In cash flow statement preparation, this approach lists the major categories of gross cash receipts and payments, offering more detail compared to the indirect method.
Operating Activities
Activities that relate to the primary operations of a company, including production, sales, and delivery of its products or services.
Q16: In Figure 10.6,assume that marginal costs are
Q17: Suppose a mechanic uses $150,000 of his
Q24: The _ effect indicates that an individual's
Q31: The firms in an oligopoly market structure
Q42: In the figure,<br>|: Marginal cost curve<br>||:
Q51: A(n) _ may offer products that are
Q60: If the total cost of producing 6
Q63: If an individual thinks about how he
Q107: Which of the following statements is true?<br>A)A
Q122: A zero economic profit is not a