The figure given below shows the revenue and cost curves of a perfectly competitive firm. Figure 9.2 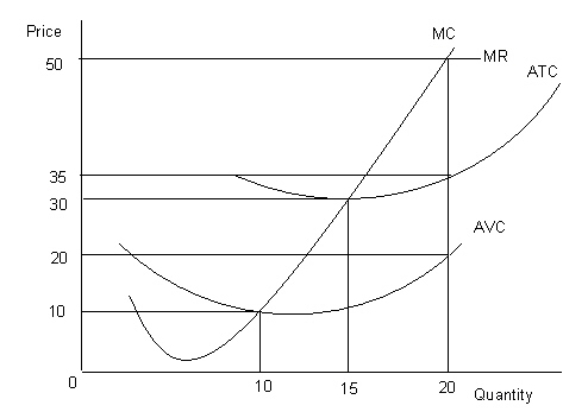
MC: Marginal cost curve
MR: Marginal revenue curve
ATC: Average-total-cost curve
AVC: Average-variable-cost curve
-Refer to Figure 9.2.The firm will suspend production if the price falls below:
Definitions:
Q2: For a perfectly competitive firm the break-even
Q11: The judicial doctrine,being a monopoly or attempting
Q29: The opportunity cost of going to the
Q37: The only decision that a perfectly competitive
Q39: Refer to Figure 12.2.The regulation will benefit
Q70: Accounting profit of a business firm is
Q116: A perfectly competitive firm faces the downward
Q117: Laws that require children to be inoculated
Q119: An individual firm in perfect competition can
Q120: Refer to Table 6.4.What is the