The figure given below shows the revenue and cost curves of a perfectly competitive firm. Figure 9.2 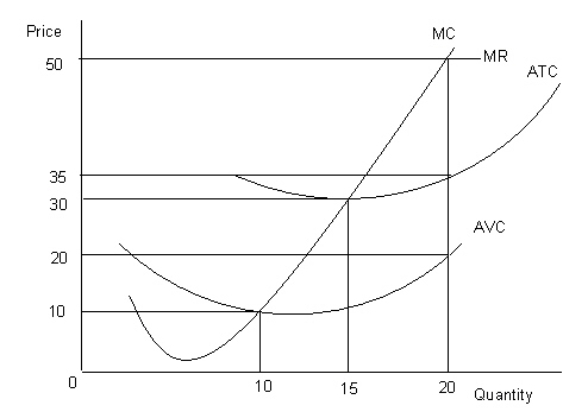
MC: Marginal cost curve
MR: Marginal revenue curve
ATC: Average-total-cost curve
AVC: Average-variable-cost curve
-Refer to Figure 9.2.What is the profit-maximizing price and output level?
Definitions:
Trade Act of 2002
A legislative measure enacted in the United States aimed at facilitating trade and strengthening the economy through various provisions.
Electronically Submit
The process of sending documents or information through electronic means, such as email or web-based platforms.
Transportation Services
Industry sector focused on moving people or goods from one place to another via various modes such as trucks, trains, ships, and airplanes.
Global Supply Chains
Refers to the worldwide interconnected networks through which goods, services, and information flow from suppliers to consumers.
Q14: The market structure in which the largest
Q23: International regulation occurs at two levels,one in
Q27: When the manager of a local movie
Q44: The greater the differentiation among products of
Q54: An increase in income _.<br>A)makes the budget
Q77: Co-payments and deductibles provide a means of
Q93: When the average cost curve lies below
Q98: If a monopolist's demand curve shifts to
Q99: In the case of automobile and medical
Q120: According to Figure 9.2,the break-even price of