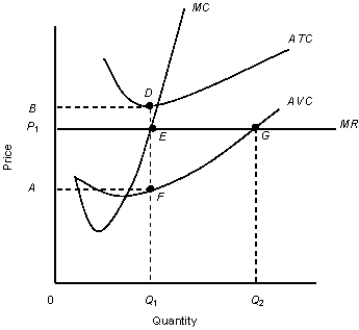
The figure given below shows the revenue and cost curves of a perfectly competitive firm.Figure 10.5
 MC: Marginal cost curve
MR: Marginal revenue curve.ATC: Average-total-cost curve
AVC: Average-variable-cost curve
-If a profit-maximizing, perfectly competitive firm is producing at a loss in the short run, then it implies that:
Definitions:
Perfectly Elastic
A situation in demand where consumers will buy an infinite quantity of goods at a certain price but none if the price increases even slightly.
Perfectly Inelastic
A demand situation where the quantity demanded does not change regardless of the price level.
Excise Tax
is a tax directly levied on certain goods, services, or activities, often with the intent to reduce their consumption or generate revenue.
Market Price
The current price at which a good or service can be bought or sold in a given market, reflecting supply and demand dynamics.
Q3: A Nash equilibrium occurs when:<br>A)a unilateral move
Q16: In Figure 10.6,assume that marginal costs are
Q27: Wikipedia and other projects utilizing wiki technology,represent
Q33: Which of the following entities is able
Q60: A monopolist always produces on the elastic
Q93: In order to practice price discrimination successfully,a
Q104: Accounting profit is called normal profit when:<br>A)accounting
Q119: Refer to Table 13.2.Suppose fish sells
Q119: In Figure 8.3,what is marginal cost at
Q120: According to Figure 9.2,the break-even price of