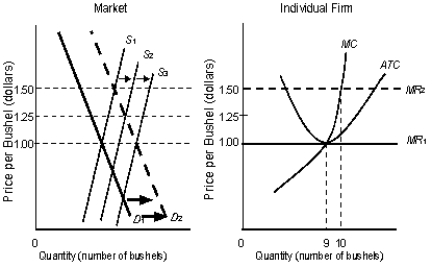
The following figure shows equilibrium at the industry and firm level.Figure 10.6
 In the figure,
S1, S2, S3 are the market supply curves.D1 and D2 are the market demand curves.MC is the marginal cost curve of the firm.MR1 and MR2 are the marginal revenue curves of the firm.ATC is the average-total-cost curve of the firm.
-Since a firm is willing to sell its product at the marginal cost and since the firm receives the market price, the difference between the two is:
Definitions:
Efficiency Wages
Efficiency wages are wages set above the market equilibrium by employers, aiming to boost productivity by increasing worker satisfaction and reducing turnover.
Labor Unions
Organizations formed by workers to protect their rights, improve working conditions, and negotiate wages and benefits with employers.
Minimum Wage
The lowest legal salary that employers can pay to workers, established by government legislation.
Right-to-Work Laws
Legislation that prohibits union security agreements, ensuring that employment is not affected by membership or non-membership in a labor union.
Q11: According to the information in Table
Q17: Diseconomies of scale:<br>A)occur only in the short
Q19: Monetary freedom refers to:<br>A)the ability to create
Q32: _ is the lack of satisfaction yielded
Q80: The study of decision making that assumes
Q89: _ measures the percentage change in quantity
Q94: When economists describe the theory of consumer
Q95: Assume that a firm's marginal revenue curve
Q115: According to the information in Scenario 8.2,how
Q125: Economists have said that deregulation of the