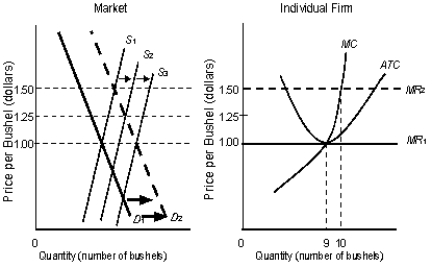
The following figure shows equilibrium at the industry and firm level.Figure 10.6
 In the figure,
S1, S2, S3 are the market supply curves.D1 and D2 are the market demand curves.MC is the marginal cost curve of the firm.MR1 and MR2 are the marginal revenue curves of the firm.ATC is the average-total-cost curve of the firm.
-Graphically, producer surplus is the area:
Definitions:
Trade Deficit
A situation where a country's imports of goods and services exceed its exports of them.
Peso Price
The value of a good or service expressed in pesos, the currency of various Latin American countries.
Exchange Rate Appreciation
Exchange rate appreciation refers to the increase in value of one currency relative to another, meaning you need fewer units of the appreciating currency to buy one unit of another currency.
Domestic Deflation
A decline in the general price level of goods and services within a domestic economy over a period of time.
Q22: Assume that the marginal revenue curve intersects
Q31: Refer to Figure 6.3.What combinations of
Q39: Refer to Figure 9.4.The total profit or
Q40: A clothing store can sell two shirts
Q43: Graphically,total revenue is represented by the:<br>A)triangle formed
Q68: A Herfindahl index of 5,000 would indicate:<br>A)a
Q95: With expansion in the level of output,total
Q105: Positive economic profit signals that the investors
Q114: If a perfectly competitive firm's price increases,then:<br>A)the
Q117: When practicing price discrimination,a firm can increase