The figure given below shows the revenue and cost curves of a firm.MC represents the marginal cost curve,AC the average cost curve,MR the marginal revenue curve,and AR the average revenue curve. Figure 8.4 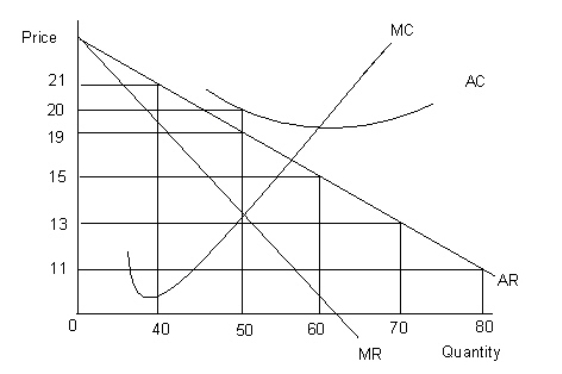
-Refer to Figure 8.4.The firm suffers a negative profit of:
Definitions:
Q18: The long-run average total cost curve connects
Q42: Refer to Figure 4.1.In which direction
Q45: Acme Tools manufactures anvils,a forging tool.When the
Q52: Which of the following reflects the correct
Q53: If marginal revenue is greater than marginal
Q56: When more and more units of a
Q87: Total utility is determined by:<br>A)multiplying the quantity
Q108: Strategic behavior occurs when:<br>A)there are a large
Q134: According to the concept of framing,when a
Q135: Assume that a consumer purchases a combination