The following graph shows the demand and cost curves of an imperfectly competitive firm.MC and ATC represent the marginal cost curve and the average cost curve respectively. Figure 8.1 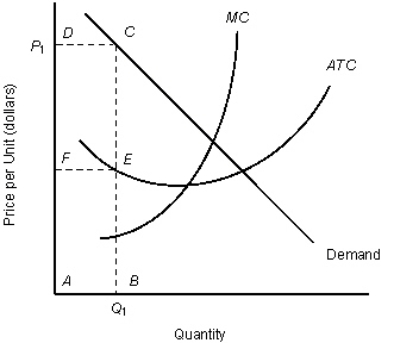
-Refer to Figure 8.1.At price P1 the firm sells quantity Q1,and total cost is shown by:
Definitions:
Marketing Research
A systematic, objective process of getting information about potential customers to guide marketing decisions.
Q19: According to Table 10.1,at what level of
Q22: A local monopoly is a firm that:<br>A)is
Q24: The _ effect indicates that an individual's
Q32: Assume that a firm is producing an
Q69: When a household owns shares of stock:<br>A)it
Q79: According to Figure 9.6,at a price of
Q82: When the average revenue falls,marginal revenue also
Q84: Restrictions on the types of food additives
Q96: The shorter the period of time being
Q131: Many agricultural products,such as wheat,are produced by