The figure given below shows cost curves of a firm. Figure: 7.2 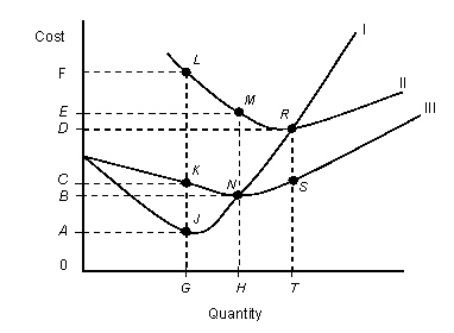
-In the figure,
|: Marginal cost curve
||: Average total cost curve
|||: Average variable cost curve
Refer to Figure 7.2.When Average Variable Cost (AVC) is at a minimum,which of the following is true?
Definitions:
Purely Competitive
A market structure characterized by many participants offering identical products, where no single buyer or seller can influence the market price.
Economic Profits
The excess of total revenue over total costs, including both explicit and implicit costs, as calculated in economic theory.
Normal Profits
The minimum level of profit necessary for a company to remain competitive in the market, essentially covering opportunity costs but not generating excess profit.
Purely Competitive
A market structure characterized by many buyers and sellers, free entry and exit, and a homogeneous product, leading to price-taking behavior.
Q15: Total utility is maximized when _.<br>A)marginal utility
Q27: Refer to Figure 10.5.Which of the following
Q74: Balance in international trade suggests that:<br>A)a trade
Q76: A deadweight loss arises in a perfectly
Q109: The figure given below shows the revenue
Q123: If market demand increases,a perfectly competitive firm
Q128: A perfectly competitive firm decides to shut
Q130: Supply curves applicable to shorter periods of
Q132: The price elasticity of demand depends on
Q134: One assumption of the model of perfect