True/False
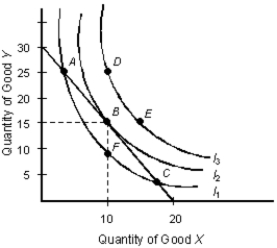
The below figure shows the various combinations of the goods X and Y that yield different levels of utility.Figure 7.3

-One explanation for the status quo bias is an aversion to loss.
Definitions:
Related Questions
Q3: Which of the following phrases correctly describes
Q9: _ is the understanding that perfect information
Q12: When total utility is at a maximum,marginal
Q14: Consider the perfectly competitive firm described
Q19: The ordering of market structures from most
Q32: The difference between average total cost and
Q54: According to the World Bank,the high-income oil-exporting
Q77: The governmental interference with the market exchange
Q102: Suppose that at a given level of
Q107: According to the information in Scenario 8.2,how