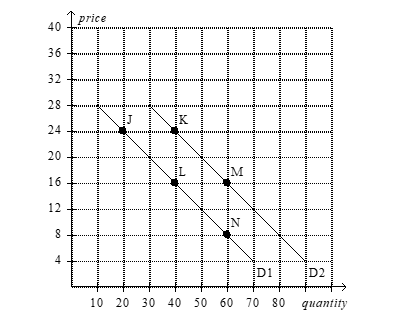
Use the following graph to answer the following questions.
a.How would point J be represented as an ordered pair?
b.What type of curve is this?
c.Does this curve show a positive or negative correlation between price and quantity?
d.Compute the slope of D1 between points J and L.
e.What is the slope of D1 between points L and N? Why would you not have to calculate this answer?
f. What is it called if we move from D1 to D2 ?
g. How do you know that the slope of D2 is the same as the slope of D1 ?
Definitions:
Equilibrium Price
The price point at which the quantity of goods supplied equals the quantity demanded, resulting in market stability.
Market Price
The current price at which an asset or service can be bought or sold in a given market.
Equilibrium Price
The market price where the quantity of goods supplied is equal to the quantity of goods demanded.
Equilibrium Quantity
The quantity of goods or services that is supplied and demanded at the equilibrium price, where demand equals supply.
Q14: Refer to Table 3-3. Which of the
Q79: Refer to Table 3-7. Japan and Korea
Q85: When describing the opportunity cost of two
Q87: Economists at which of the following offices
Q131: Efficiency is illustrated by<br>A)both the production possibilities
Q148: A survey of professional economists revealed that
Q310: Congress relies on economists at the Congressional
Q327: A market includes<br>A)buyers only.<br>B)sellers only.<br>C)both buyers and
Q392: Which of the following is not an
Q477: When two variables move in the same