Multiple Choice
Figure 9-19.On the diagram below,Q represents the quantity of textiles and P represents the price of textiles. 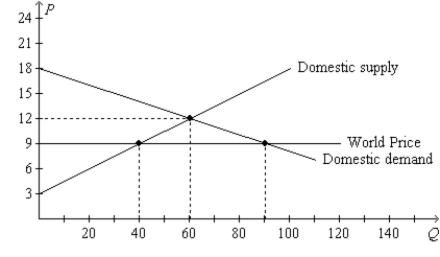
-Refer to Figure 9-19.With free trade,consumer surplus in the textile market amounts to
Definitions:
Related Questions
Q57: Domestic producers of a good become better
Q74: Refer to Table 10-2. What were Crete's
Q111: The world price of cotton is the
Q142: The world price of a ton of
Q149: Tariffs and quotas are different in the
Q244: Refer to Figure 9-14. The country for
Q253: Import quotas and tariffs produce some common
Q331: The more elastic the supply, the larger
Q384: In order to include many different goods
Q420: Refer to Figure 8-11. Suppose Q<sub>1</sub> =