Figure 13-4. On the horizontal axis of the graph, L represents the quantity of loanable funds in billions of dollars. 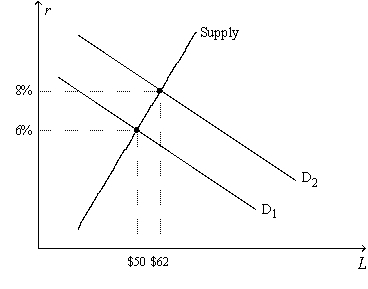
-Refer to Figure 13-4. Regard the position of the Supply curve as fixed, as on the graph. If the real interest rate is 8 percent, the inflation rate is 3 percent, and the market for loanable funds is in equilibrium, then the position of the demand-for-loanable-funds curve must be
Definitions:
Shareholder Dividends
A distribution of earnings to shareholders by a corporation, usually in the form of profit sharing.
Liabilities to Stockholders' Equity
A measure comparing a company’s obligations to the amount invested by its shareholders, often used to assess financial health.
Creditors' Risk
The risk that debtors will fail to make payments on debts owed, affecting creditors' financial positions.
Nonpayment
The failure to fulfill a financial obligation, such as not paying bills, debts, or invoices when they are due.
Q18: Other things the same, higher population growth<br>A)raises
Q30: Which of the following actions best illustrates
Q35: Which of the following changes would increase
Q51: Mutual funds are a type of financial
Q71: If stock prices follow a random walk,
Q99: Ethan purchases a new house for $170,000.
Q119: The K-Nine dog food company is considering
Q182: Refer to Figure 13-2. Which of the
Q392: If Congress instituted an investment tax credit<br>A)it
Q418: The field of finance primarily studies<br>A)how society