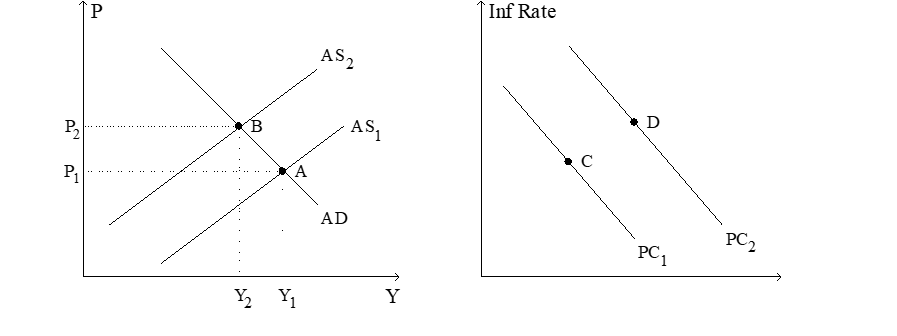
Figure 22-8. The left-hand graph shows a short-run aggregate-supply (SRAS) curve and two aggregate-demand (AD) curves. On the right-hand diagram, "Inf Rate" means "Inflation Rate." 
-Refer to Figure 22-8. What is measured along the horizontal axis of the right-hand graph?
Definitions:
Audience Understand
The degree to which the intended audience comprehends or grasps the information presented to them.
Images
Visual representations or depictions used to convey ideas, information, or emotions.
Designs
The process of envisioning and planning the creation of objects, systems, or measurable human interactions.
Professionalism
The competence, skill, and conduct expected of an individual in a work or business environment.
Q56: Those who desire that policymakers stabilize the
Q65: In Exhibit 1-3, for any value of
Q80: Phillips found a<br>A)positive relation between unemployment and
Q114: In practice, the problems created by time
Q155: Over the long run the Volcker disinflation<br>A)shifted
Q210: Studies have shown significant spending changes arise
Q212: In 2009 the federal debt was about<br>A)$17
Q257: If policymakers expand aggregate demand, then in
Q336: There is a<br>A)short-run tradeoff between inflation and
Q360: In the long run, if the Fed