Multiple Choice
Exhibit 1-16 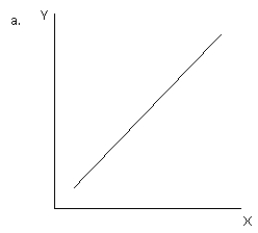
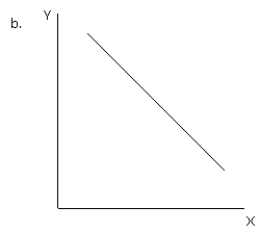
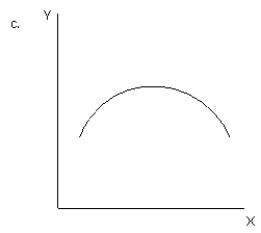
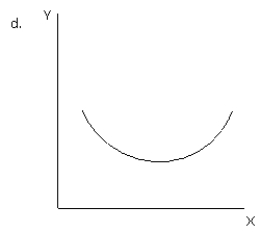
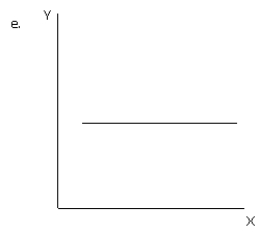
-Refer to Exhibit 1-16.Which graph illustrates a positive relationship between variable X and variable Y initially but then a negative relationship?
Definitions:
Related Questions
Q13: Which of the following statements regarding imports
Q74: The time inconsistency of policy implies that<br>A)what
Q81: Means-tested government benefits base benefits on<br>A)a household's
Q95: Stimulus spending in 2009 was used for<br>A)building
Q128: In 2009 Barack Obama responded to recession<br>A)only
Q142: In one week, Mohammed can knit 5
Q178: Explain how it is possible for the
Q200: The Fed raised interest rates in 2004
Q234: Some economists believe that there are positives
Q298: An increase in inflation expectations shifts the