Figure 2.5 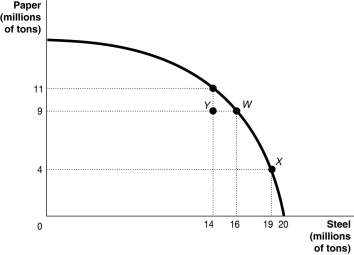 Alt text for Figure 2.5: In figure 2.5, a graph compares paper and steel production.
Long description for Figure 2.5: The x-axis is labelled, steel in millions of tons and the quantities 14, 16, 19, and 20 are marked.The y-axis is labelled, paper in millions of tons, and the quantities 4, 9, and 11 are marked.Points Y(14, 9) , W(16, 9) , (19, 4) , and an unnamed point (14, 11) are plotted on the graph, and joined to the respective axes using dotted lines.A concave curve is drawn from the y-axis to the x-axis, passing through the unnamed point (14, 11) , and points W(16, 9) , and X(19, 4) .Point Y is between the curve and the axes.
-Refer to Figure 2.5. If this economy is currently producing at point X, what is the opportunity cost of moving to point W?
Definitions:
Mutual Funds
Investment programs funded by shareholders that trade in diversified holdings and are professionally managed.
Credit Card Debt
A type of unsecured liability which accrues when a consumer purchases goods or services with a credit card and fails to pay back the borrowed amount within the stipulated period.
Car Loan
A personal loan used to purchase a car, paid back in installments over a period of time, usually with interest.
Mortgage Rate
The interest rate charged on a mortgage, determining the size of the monthly payments by the borrower to the lender.
Q19: If society decides it wants more of
Q24: A randomly selected sample is always representative.
Q27: SONY's continued production of Betamax systems well
Q32: Which of the following in an experiment
Q115: "An increase in the price of gasoline
Q159: Refer to Figure 2.6.Assume a technological advancement
Q235: Factory incentives on cell phones have encouraged
Q243: Refer to Figure 3.3.A decrease in the
Q243: A stand of redwood trees is not
Q296: Refer to Figure 2.10.A movement from _