Figure 2.9 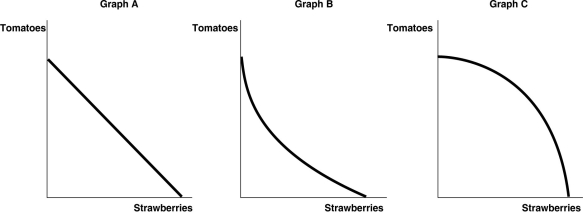 Alt text for Figure 2.9: In figure 2.9, 3 graphs, A, B, and C depict production possibilities frontier for Carlos Vanya.
Long description for Figure 2.9: Graph A: The x-axis is labelled, strawberries, and the y-axis is labelled, tomatoes.A line slopes from the top left corner of the quadrant, near the end of the y-axis, down to the bottom right corner, near the end of the x-axis.Graph B: The x-axis is labelled, strawberries, and the y-axis is labelled, tomatoes.A concave curve begins in the top left corner of the quadrant, near the top of the y-axis, and ends near the end of the y-axis.Graph C: The x-axis is labelled, strawberries, and the y-axis is labelled, tomatoes.A convex curve begins in the top left corner, near the top of the y-axis, and ends in the bottom right corner, near the end of the y-axis.
-Refer to Figure 2.9.Carlos Vanya grows tomatoes and strawberries on his land.A portion of his land is more suitable for growing tomatoes and the other portion is better suited for strawberry cultivation.Which of the graphs in Figure 2.9 represent his production possibilities frontier?
Definitions:
Equal to Price
Equal to price refers to a situation where a particular value, cost, or measure is identical to the price level of a good or service, indicating a direct correlation between the two.
Total Revenue
The total amount of money received by a company from sales of its products or services before any expenses are subtracted.
Total Output
The total quantity of goods or services produced by a firm or economy.
Perfect Competition
A market structure characterized by a large number of small firms, a homogenous product, perfect information, and easy entry and exit, leading to firms being price takers.
Q11: Which of the following is true of
Q17: Refer to Figure 2.1.Point C is<br>A)technically efficient.<br>B)unattainable
Q38: Which of the following is true of
Q174: Which of the following statements about an
Q176: Refer to Figure 2.4.Consider the following events:
Q223: An outward shift of a nation's production
Q228: Refer to Figure 2.13.What is the opportunity
Q232: Which of the following statements about an
Q269: Refer to Table 2.6.China has a comparative
Q286: Whether a good is normal or inferior