Figure 3.4 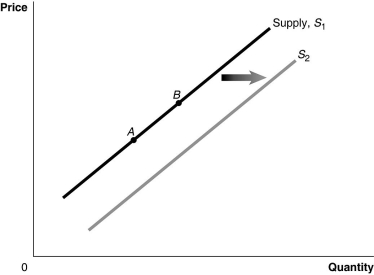 Alt text for Figure 3.4: In figure 3.4, a graph of the effect of technological advancement on supply curve.
Long description for Figure 3.4: The x-axis is labelled, Quantity, and the y-axis is labelled, Price.Curve Supply, S1, is a straight line which slopes up from the bottom left corner to the top right corner.2 points, A and B, are marked in the middle of curve S1.Curve S2 follows the same slope as curve S1, but is plotted to the right.A right pointing arrow indicates the change from curve S1 to curve S2.
-Refer to Figure 3.4.A decrease in the price of inputs would be represented by a movement from
Definitions:
Specified Measure
A particular metric or standard defined for the purpose of evaluation, assessment, or calculation within a given context.
Natural Zero
A point on a scale that indicates the absence of the quantity being measured, indicating a true zero point where the measured phenomenon is nonexistent.
Important Decisions
Significant choices made after careful consideration, which have a considerable impact on outcomes or results.
Variation
The extent to which data points in a dataset differ from each other and from the mean of the dataset; critical in statistical analysis for understanding data dispersion.
Q43: Refer to Figure 2.18.Which two arrows in
Q47: Disposable household income equals household income<br>A)minus personal
Q94: Households _ final goods and services in
Q125: If an increase in income leads to
Q128: Which of the following would cause the
Q148: In the circular flow model, households demand
Q209: If a commercial dairy farm wants to
Q213: Refer to Figure 2.2.Suppose Atikamekw Cree are
Q247: How does Adam Smith's idea of the
Q266: Refer to Table 2.12.Does either Estonia or