Figure 3.12 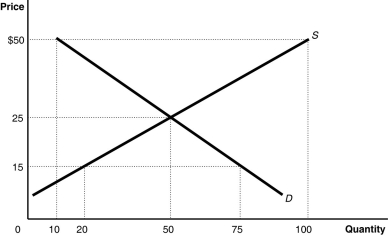 Alt text for Figure 3.12: In figure 3.23, a graph plotting intersecting supply and demand curves represents the market for coffee grinders.
Long description for Figure 3.12: The x-axis is labelled, Quantity, with the values 0, 10, 20, 50, 75, and 100 marked.The y-axis is labelled, Price, with the values 0, 15, 25, and 50 dollars marked.Curve D is a straight line which slopes down from the top left corner to the bottom right corner.Curve S is a straight line which begins in the bottom left corner and slopes up to the top right corner.The equilibrium of the 2 curves is (50,25) .The point plotted on curve S to the left of equilibrium is (20,15) .The point plotted on curve D to the right of point of equilibrium is (75,15) .The point plotted to the right of equilibrium on curve S is (100,50) .The point plotted to the right of the equilibrium on curve D is (10,50) .
-Refer to Figure 3.12.The figure above represents the market for coffee grinders.Compare the conditions in the market when the price is $15 and when the price is $21.Which of the following describes how the market differs at these prices?
Definitions:
Specialized Knowledge
Expertise or skills in a specific field or subject area, typically acquired through education or experience.
Host-Country Nationals
Employees who are citizens of the country in which a multinational corporation's subsidiary operates, working in their own country for that subsidiary.
Nonmanagerial Employees
Workers who do not hold supervisory or managerial positions and are typically responsible for executing specific tasks and operations.
Hardship Premium
A hardship premium (also called a foreign service premium) is an additional financial incentive offered to individuals to entice them to accept a “less than attractive” international assignment.
Q20: All of the following countries come close
Q22: Marla is an architect who is designing
Q104: In 2017, Kendall Ford, an automobile dealership,
Q119: Real GDP will increase<br>A)only if the price
Q143: Assuming that Canada is the domestic economy,
Q163: Refer to Figure 3.12.The figure above represents
Q201: What is the underground economy and how
Q238: Explain how it would be possible for
Q279: _ opportunity cost implies that as more
Q296: How would the unemployment rate and the