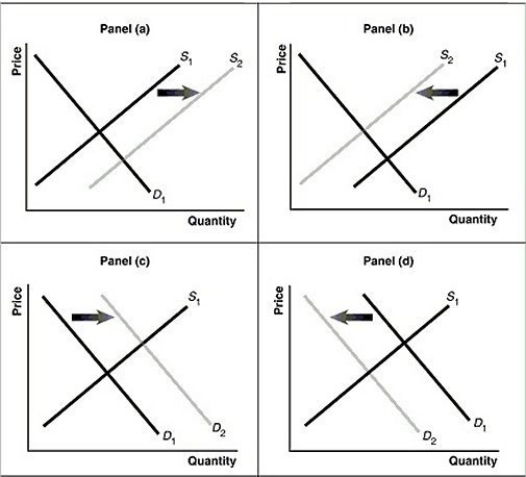
Figure 3.13  Alt text for Figure 3.13a: In figure 3.13a, a graph of intersecting demand and supply curves represents a rising supply of bicycle helmets.
Long description for Figure 3.13a: The x-axis is labelled, Quantity and the y-axis is labelled, as Price.Curve D1 is a straight line which slopes down from the top left corner to the bottom right corner.Curve S1 is a straight line which slopes up from the bottom left to the top right.The point of intersection is at the midpoints of both lines.Curve S2 is a straight line, parallel to curve S1, but plotted to the right.A right pointing arrow indicates the change from S1 to S2.
Alt text for Figure 3.13b: In figure 3.13b, a graph of intersecting demand and supply curves represents a falling supply of bicycle helmets.
Long description for Figure 3.13b: The x-axis is labelled, Quantity and the y-axis is labelled, as Price.Curve D1 is a straight line which slopes down from the top left corner to the bottom right corner.Curve S1 is a straight line which slopes up from the bottom left to the top right.The point of intersection is at the midpoints of both lines.Curve S2 is a straight line, parallel to curve S1, but plotted to the left.A left pointing arrow indicates the change from S1 to S2.
Alt text for Figure 3.13c: In figure 3.13c, a graph of intersecting demand and supply curves represents a rising demand for bicycle helmets.
Long description for Figure 3.13c: The x-axis is labelled, Quantity and the y-axis is labelled, as Price.Curve D1 is a straight line which slopes down from the top left corner to the bottom right corner.Curve S1 is a straight line which slopes up from the bottom left to the top right.The point of intersection is at the midpoints of both lines.Curve D2 is a straight line, parallel to curve D1, but plotted to the right.A right pointing arrow indicates the change from D1 to D2.
Alt text for Figure 3.13d: In figure 3.13d, a graph of intersecting demand and supply curves represents a falling demand for bicycle helmets.
Long description for Figure 3.13d: The x-axis is labelled, Quantity and the y-axis is labelled, as Price.Curve D1 is a straight line which slopes down from the top left corner to the bottom right corner.Curve S1 is a straight line which slopes up from the bottom left to the top right.The point of intersection is at the midpoints of both lines.Curve D2 is a straight line, parallel to curve D1, but plotted to the left.A left pointing arrow indicates the change from D1 to D2.
-Refer to Figure 3.13.Assume that the graphs in this figure represent the demand and supply curves for potatoes and that steak and potatoes are complements.What panel describes what happens in this market when the price of steak rises?
Definitions:
Substance Abuse
The harmful or hazardous use of psychoactive substances, including alcohol and illicit drugs.
Nonpharmacological Interventions
Treatments that do not involve medications but use other methods to relieve symptoms, such as physical therapy, exercise, and psychological therapy.
Extreme Pain
A severe level of discomfort or pain, often requiring immediate medical attention or intervention.
Patient-Controlled Analgesia
A method of pain management that allows the patient to self-administer a pre-set dose of pain medication, usually via a pump.
Q30: George Gnat subscribes to a monthly pest
Q35: If a country passes a labour law
Q41: If nominal GDP is $5 trillion and
Q49: Which of the following would result in
Q139: The value of what a Canadian-owned Tim
Q154: Refer to Figure 2.8.The linear production possibilities
Q155: According to the text, economists consider full
Q185: Nearly a quarter of China's 1.3 billion
Q194: The underground economy-the informal sector-can be a
Q288: In the modern Canadian economy, the typical