Figure 3.15 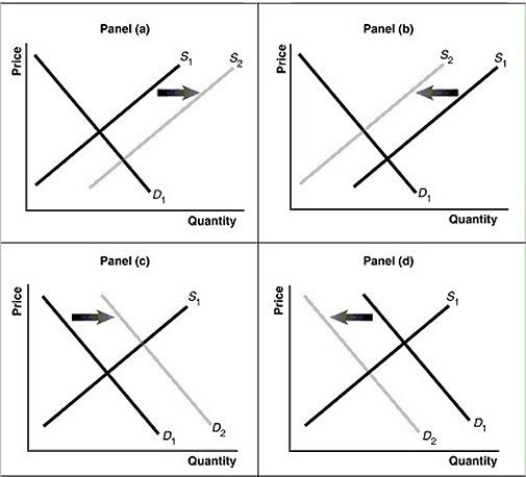 Alt text for Figure 3.15a: In figure 3.15a, a graph of intersecting demand and supply curves represents a rising supply of Blu-ray disc players.
Long description for Figure 3.15a: The x-axis is labelled, Quantity and the y-axis is labelled, as Price.Curve D1 is a straight line which slopes down from the top left corner to the bottom right corner.Curve S1 is a straight line which slopes up from the bottom left to the top right.The point of intersection is at the midpoints of both lines.Curve S2 is a straight line, parallel to curve S1, but plotted to the right.A right pointing arrow indicates the change from S1 to S2.
Alt text for Figure 3.15b: In figure 3.15b, a graph of intersecting demand and supply curves represents a falling supply of Blu-ray players.
Long description for Figure 3.15b: The x-axis is labelled, Quantity and the y-axis is labelled, as Price.Curve D1 is a straight line which slopes down from the top left corner to the bottom right corner.Curve S1 is a straight line which slopes up from the bottom left to the top right.The point of intersection is at the midpoints of both lines.Curve S2 is a straight line, parallel to curve S1, but plotted to the left.A left pointing arrow indicates the change from S1 to S2.
Alt text for Figure 3.15c: In figure 3.15c, a graph of intersecting demand and supply curves represents a rising demand for Blu-ray players.
Long description for Figure 3.15c: The x-axis is labelled, Quantity and the y-axis is labelled, as Price.Curve D1 is a straight line which slopes down from the top left corner to the bottom right corner.Curve S1 is a straight line which slopes up from the bottom left to the top right.The point of intersection is at the midpoints of both lines.Curve D2 is a straight line, parallel to curve D1, but plotted to the right.A right pointing arrow indicates the change from D1 to D2.
Alt text for Figure 3.15d: In figure 3.15d, a graph of intersecting demand and supply curves represents a falling demand for Blu-ray disc players.
Long description for Figure 3.15d: The x-axis is labelled, Quantity and the y-axis is labelled, as Price.Curve D1 is a straight line which slopes down from the top left corner to the bottom right corner.Curve S1 is a straight line which slopes up from the bottom left to the top right.The point of intersection is at the midpoints of both lines.Curve D2 is a straight line, parallel to curve D1, but plotted to the left.A left pointing arrow indicates the change from D1 to D2.
-Refer to Figure 3.15.Assume that the graphs in this figure represent the demand and supply curves for blu-ray discs.Which panel best describes what happens in this market if there is a substantial increase in the price of blu-ray players?
Definitions:
Debt and Equity
Two of the main ways companies can raise capital; debt involves borrowing money, whereas equity involves selling a stake in the company.
Equity Account
An account that represents the owner's equity or interest in a company, usually comprising investments made by the shareholders and retained earnings.
Compensation Package
The total remuneration, including salary, bonuses, benefits, and any other financial rewards, provided to an employee.
Proxy Fight
A battle for control of a company where opposing sides attempt to win the votes of shareholders to achieve a particular outcome during the company's annual meeting.
Q1: Most economists believe that labour unions significantly
Q1: As the number of firms in a
Q4: In a free market there are virtually
Q19: Which of the following statements is true
Q129: Explain the difference between gross domestic product
Q148: In the circular flow model, the value
Q164: In the circular flow diagram, the value
Q260: Several studies have shown promising links between
Q271: Refer to Figure 2.14.Which country has a
Q306: Refer to Figure 2.12.In response to changing