Figure 3.15 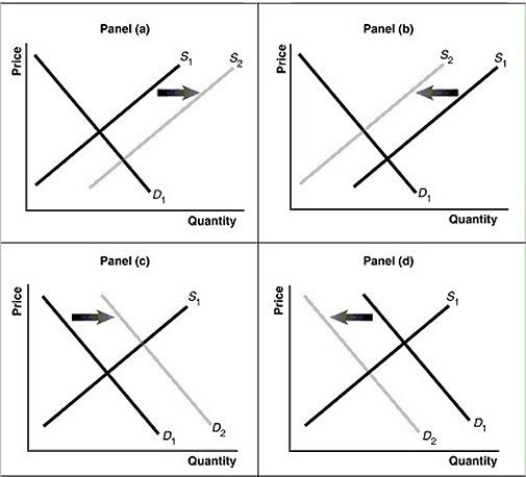 Alt text for Figure 3.15a: In figure 3.15a, a graph of intersecting demand and supply curves represents a rising supply of Blu-ray disc players.
Long description for Figure 3.15a: The x-axis is labelled, Quantity and the y-axis is labelled, as Price.Curve D1 is a straight line which slopes down from the top left corner to the bottom right corner.Curve S1 is a straight line which slopes up from the bottom left to the top right.The point of intersection is at the midpoints of both lines.Curve S2 is a straight line, parallel to curve S1, but plotted to the right.A right pointing arrow indicates the change from S1 to S2.
Alt text for Figure 3.15b: In figure 3.15b, a graph of intersecting demand and supply curves represents a falling supply of Blu-ray players.
Long description for Figure 3.15b: The x-axis is labelled, Quantity and the y-axis is labelled, as Price.Curve D1 is a straight line which slopes down from the top left corner to the bottom right corner.Curve S1 is a straight line which slopes up from the bottom left to the top right.The point of intersection is at the midpoints of both lines.Curve S2 is a straight line, parallel to curve S1, but plotted to the left.A left pointing arrow indicates the change from S1 to S2.
Alt text for Figure 3.15c: In figure 3.15c, a graph of intersecting demand and supply curves represents a rising demand for Blu-ray players.
Long description for Figure 3.15c: The x-axis is labelled, Quantity and the y-axis is labelled, as Price.Curve D1 is a straight line which slopes down from the top left corner to the bottom right corner.Curve S1 is a straight line which slopes up from the bottom left to the top right.The point of intersection is at the midpoints of both lines.Curve D2 is a straight line, parallel to curve D1, but plotted to the right.A right pointing arrow indicates the change from D1 to D2.
Alt text for Figure 3.15d: In figure 3.15d, a graph of intersecting demand and supply curves represents a falling demand for Blu-ray disc players.
Long description for Figure 3.15d: The x-axis is labelled, Quantity and the y-axis is labelled, as Price.Curve D1 is a straight line which slopes down from the top left corner to the bottom right corner.Curve S1 is a straight line which slopes up from the bottom left to the top right.The point of intersection is at the midpoints of both lines.Curve D2 is a straight line, parallel to curve D1, but plotted to the left.A left pointing arrow indicates the change from D1 to D2.
-Refer to Figure 3.15.Assume that the graphs in this figure represent the demand and supply curves for laptop computers.Which panel best describes what happens in this market when the price of computer hard drives falls?
Definitions:
Imprinting
A rapid learning process that occurs within a critical or sensitive period and forms a lasting attachment or behavioral pattern.
Attachment
An emotional bond between individuals, especially evident in close personal relationships, including those between parents and their children.
Accommodation
The cognitive process of modifying existing cognitive schemas, perceptions, or understanding to incorporate new information.
Schema
A cognitive framework or concept that helps organize and interpret information.
Q28: An increase in Employment Insurance payments would,
Q31: In October, market analysts predict that the
Q38: In response to a shortage, the market
Q40: Refer to Figure 3.14.The graph in this
Q100: The substitution effect of a price change
Q113: If a country produces only two goods,
Q183: If the price level rose in three
Q185: Nearly a quarter of China's 1.3 billion
Q187: Refer to Figure 3.15.Assume that the graphs
Q201: If the number of unemployed workers is