Figure 3.4 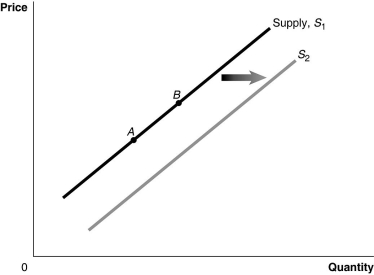 Alt text for Figure 3.4: In figure 3.4, a graph of the effect of technological advancement on supply curve.
Long description for Figure 3.4: The x-axis is labelled, Quantity, and the y-axis is labelled, Price.Curve Supply, S1, is a straight line which slopes up from the bottom left corner to the top right corner.2 points, A and B, are marked in the middle of curve S1.Curve S2 follows the same slope as curve S1, but is plotted to the right.A right pointing arrow indicates the change from curve S1 to curve S2.
-Refer to Figure 3.4.A decrease in the price of inputs would be represented by a movement from
Definitions:
Q4: Refer to Figure 3.8.The figure above represents
Q23: Refer to Figure 2.1.Point A is<br>A)technically efficient.<br>B)unattainable
Q35: If a country passes a labour law
Q118: Consider the following events:<br>a.a decrease in the
Q131: Technological advancements have led to lower prices
Q168: Specializing in the production of a good
Q188: Refer to Figure 3.4.A technological advancement would
Q206: The GDP deflator in year 2 is
Q274: An issue with the Labour Force Survey
Q275: When deciding on which new products to