Figure 3.5 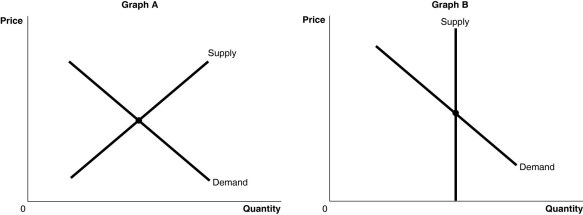 Alt text for Figure 3.5a: In figure 3.5a, a graph of intersecting supply and demand curves representing the markets for original Picasso paintings and designer jeans.
Long description for Figure 3.5a: The x-axis is labelled, Quantity, and the y-axis is labelled, Price.Curve Supply is a straight line which slopes up from the bottom left corner to the top right corner.Curve Demand is a straight line which slopes down from the top left corner to the bottom right corner.The 2 curves intersect at their respective midpoints.
Alt text for Figure 3.5b: In figure 3.5b, a graph of intersecting supply and demand curves represents one of the two markets for original Picasso paintings and designer jeans.
Long description for Figure 3.5b: The x-axis is labelled, Quantity, and the y-axis is labelled, Price.Curve Demand is a straight line which slopes down from the top left corner to the bottom right corner.Curve Supply is a straight, vertical line beginning from approximate midpoint of the x axis.The 2 curves intersect at their respective midpoints.
-In 2016, forest fires forced the evacuation of Fort McMurray. Many of those evacuated went to Edmonton. As a result of the evacuation, what would we expect to see in the market for hotel rooms in Edmonton at the original equilibrium price?
Definitions:
Q13: Refer to Figure 3.2.An increase in the
Q34: Refer to Figure 2.8.Suppose Vidalia is currently
Q55: Refer to Figure 2.6.Assume that in 2019,
Q84: _ shows that if all resources are
Q157: a. Draw a production possibilities frontier for
Q166: At a product's equilibrium price,<br>A)anyone who needs
Q172: The income earned by those who supply
Q177: If an increase in crime causes households
Q213: If the quantity of goods and services
Q258: Refer to Table 4.5.The value added by