Figure 3.7 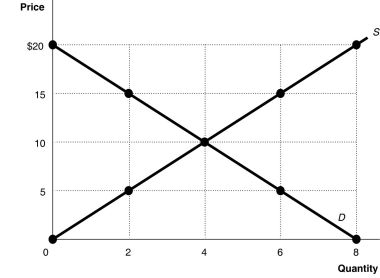 Alt text for Figure 3.7: In figure 3.7, a graph plotting intersecting supply and demand curves illustrates surplus and shortage in a market, along with an equilibrium.
Long description for Figure 3.7: The x-axis is labelled, Quantity, and is marked from 0 to 8 in increments of 2.The y-axis is labelled, Price, and is marked from 0 to 20 dollars in increments of 5.Curve D is a straight line which slopes down from the top left corner to the bottom right corner.Curve S is a straight line which begins in the bottom left corner and slopes up to the top right corner.The equilibrium of the 2 curves is marked at (4,10) .2 points plotted on the demand curve to the left of the equilibrium are (0,20) and (2,15) .2 points plotted on the demand curve to the right of the equilibrium are (6,5) and (8,0) .2 points plotted on the supply curve to the right of the equilibrium are (6,15) and (8,20) .2 points plotted on the supply curve to the left of the equilibrium are (2,5) and (0,0) .
-Refer to Figure 3.7.In a free market such as that depicted above, a surplus is eliminated by
Definitions:
Knowledge of Institution
An understanding of the structures, roles, and dynamics within an organization or system.
Dehumanize Inmates
Treating prison inmates as if they are not human beings, often by denying them respect and dignity.
Sanctions
Official penalties or restrictive measures imposed by countries or international bodies against entities, individuals, or countries to compel compliance with international laws or norms.
Society
A group of individuals living together in a more or less ordered community, sharing common traditions, institutions, and interests.
Q6: An example of a factor of production
Q13: Refer to Figure 3.2.An increase in the
Q51: Refer to Table 4.13.Real GDP for Vicuna
Q52: The largest component of spending in GDP
Q59: Without an increase in the supplies of
Q153: Cyclical unemployment is the result of<br>A)a persistent
Q167: An increase in population shifts the production
Q191: Why does inflation make nominal GDP a
Q220: If a firm has an incentive to
Q226: Refer to Table 4.9.Suppose that the above