Figure 3.10 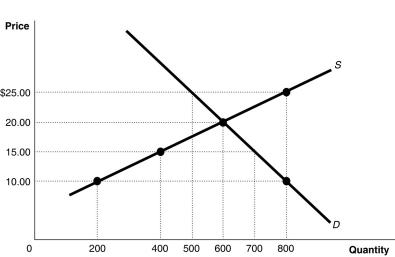 Alt text for Figure 3.10: In figure 3.10, a graph plotting intersecting supply and demand curves illustrates how supply and demand function in competitive markets.
Long description for Figure 3.10: The x-axis is labelled, Quantity, with the values 0, 200, 400, 500, 600, 700 and 800 marked.The y-axis is labelled, Price, with the values 0, 10.00, 15.00, 20.00 and 25.00 dollars marked.Supply Curve S is a straight line which slopes up from the bottom left corner to the top right corner.4 points are plotted along the curve; (200, 10) , (400, 15) , (600, 20) , and (800, 25) .Demand curve D is a straight line which slopes down from the top left corner to the bottom right corner.Curve D intersects the S curve at (600, 20) , and passes through another point, (800, 10) .All plotted points are connected to the corresponding values on the x and y-axis with dotted lines.
-Refer to Figure 3.10.At a price of $25, how many units will be sold?
Definitions:
Computer Literacy Rate
The percentage of the population that has an understanding of computers and their functionality, often including the ability to use software and internet applications.
Per Capita GDPs
The average economic output per person, calculated by dividing the Gross Domestic Product of a country by its total population.
Less Developed Countries
Nations with low levels of economic resources, industrialization, and Human Development Index ratings compared to other countries.
Economic Development
The progress in economic and social well-being including higher income, improved standards of living, and reduction of poverty.
Q6: If consumers believe the price of iPads
Q11: People who lost their jobs as hand-drawn
Q65: A supply curve<br>A)is a table that shows
Q72: Canadian GDP shrank in the first half
Q98: Consider the following events:<br>a.an increase in the
Q124: Aging baby boomers are expected to have
Q165: The most important group not identified by
Q234: High-income countries such as Canada spend a
Q301: In a two-good, two-country world, if one
Q309: By drawing a demand curve with price