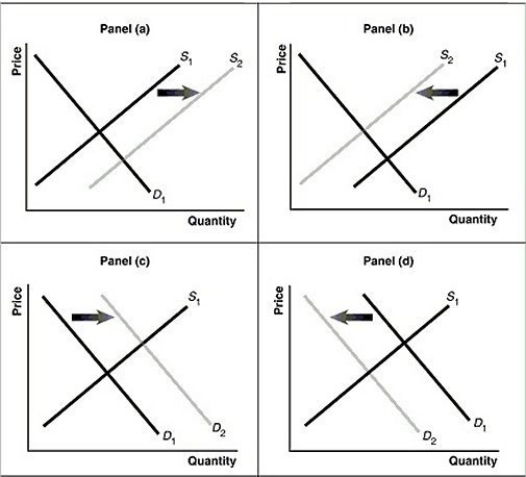
Figure 3.13  Alt text for Figure 3.13a: In figure 3.13a, a graph of intersecting demand and supply curves represents a rising supply of bicycle helmets.
Long description for Figure 3.13a: The x-axis is labelled, Quantity and the y-axis is labelled, as Price.Curve D1 is a straight line which slopes down from the top left corner to the bottom right corner.Curve S1 is a straight line which slopes up from the bottom left to the top right.The point of intersection is at the midpoints of both lines.Curve S2 is a straight line, parallel to curve S1, but plotted to the right.A right pointing arrow indicates the change from S1 to S2.
Alt text for Figure 3.13b: In figure 3.13b, a graph of intersecting demand and supply curves represents a falling supply of bicycle helmets.
Long description for Figure 3.13b: The x-axis is labelled, Quantity and the y-axis is labelled, as Price.Curve D1 is a straight line which slopes down from the top left corner to the bottom right corner.Curve S1 is a straight line which slopes up from the bottom left to the top right.The point of intersection is at the midpoints of both lines.Curve S2 is a straight line, parallel to curve S1, but plotted to the left.A left pointing arrow indicates the change from S1 to S2.
Alt text for Figure 3.13c: In figure 3.13c, a graph of intersecting demand and supply curves represents a rising demand for bicycle helmets.
Long description for Figure 3.13c: The x-axis is labelled, Quantity and the y-axis is labelled, as Price.Curve D1 is a straight line which slopes down from the top left corner to the bottom right corner.Curve S1 is a straight line which slopes up from the bottom left to the top right.The point of intersection is at the midpoints of both lines.Curve D2 is a straight line, parallel to curve D1, but plotted to the right.A right pointing arrow indicates the change from D1 to D2.
Alt text for Figure 3.13d: In figure 3.13d, a graph of intersecting demand and supply curves represents a falling demand for bicycle helmets.
Long description for Figure 3.13d: The x-axis is labelled, Quantity and the y-axis is labelled, as Price.Curve D1 is a straight line which slopes down from the top left corner to the bottom right corner.Curve S1 is a straight line which slopes up from the bottom left to the top right.The point of intersection is at the midpoints of both lines.Curve D2 is a straight line, parallel to curve D1, but plotted to the left.A left pointing arrow indicates the change from D1 to D2.
-Refer to Figure 3.13.Assume that the graphs in this figure represent the demand and supply curves for used clothing, an inferior good.Which panel describes what happens in this market as a result of a decrease in income?
Definitions:
Direct Materials Purchases
The total amount of raw materials bought by a company for use in production during a specific accounting period.
Material B
A generic term often used to denote a specific type of material used in the manufacturing or production process.
Budgeted Total Sales
The estimated total revenue that a business plans to generate from goods or services sold within a specific period.
Sales Estimates
Projections or predictions about the amount of revenue that will be generated through sales activities within a certain period.
Q7: Refer to Table 4.20.What is real GDP
Q37: Refer to Table 3.1.The table above shows
Q91: Chips and salsa are complements.If the price
Q95: Refer to Figure 2.10.A movement from _
Q129: The market for energy drinks has become
Q166: Government spending on subsidies is included in
Q188: It is not possible to have a
Q249: Adam Smith, the father of modern economics,
Q281: Refer to Table 3.5.The equations above describe
Q292: It is possible to have a comparative