Figure 3.15 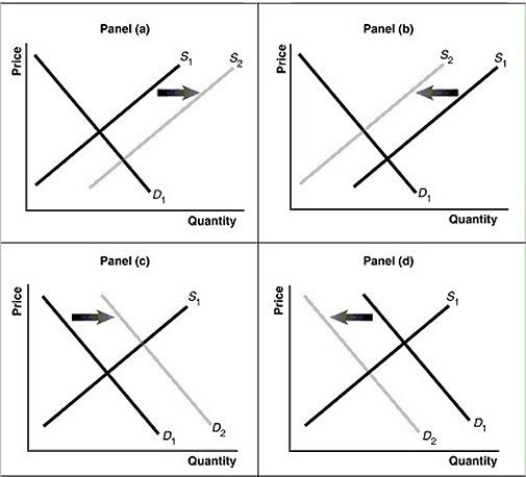 Alt text for Figure 3.15a: In figure 3.15a, a graph of intersecting demand and supply curves represents a rising supply of Blu-ray disc players.
Long description for Figure 3.15a: The x-axis is labelled, Quantity and the y-axis is labelled, as Price.Curve D1 is a straight line which slopes down from the top left corner to the bottom right corner.Curve S1 is a straight line which slopes up from the bottom left to the top right.The point of intersection is at the midpoints of both lines.Curve S2 is a straight line, parallel to curve S1, but plotted to the right.A right pointing arrow indicates the change from S1 to S2.
Alt text for Figure 3.15b: In figure 3.15b, a graph of intersecting demand and supply curves represents a falling supply of Blu-ray players.
Long description for Figure 3.15b: The x-axis is labelled, Quantity and the y-axis is labelled, as Price.Curve D1 is a straight line which slopes down from the top left corner to the bottom right corner.Curve S1 is a straight line which slopes up from the bottom left to the top right.The point of intersection is at the midpoints of both lines.Curve S2 is a straight line, parallel to curve S1, but plotted to the left.A left pointing arrow indicates the change from S1 to S2.
Alt text for Figure 3.15c: In figure 3.15c, a graph of intersecting demand and supply curves represents a rising demand for Blu-ray players.
Long description for Figure 3.15c: The x-axis is labelled, Quantity and the y-axis is labelled, as Price.Curve D1 is a straight line which slopes down from the top left corner to the bottom right corner.Curve S1 is a straight line which slopes up from the bottom left to the top right.The point of intersection is at the midpoints of both lines.Curve D2 is a straight line, parallel to curve D1, but plotted to the right.A right pointing arrow indicates the change from D1 to D2.
Alt text for Figure 3.15d: In figure 3.15d, a graph of intersecting demand and supply curves represents a falling demand for Blu-ray disc players.
Long description for Figure 3.15d: The x-axis is labelled, Quantity and the y-axis is labelled, as Price.Curve D1 is a straight line which slopes down from the top left corner to the bottom right corner.Curve S1 is a straight line which slopes up from the bottom left to the top right.The point of intersection is at the midpoints of both lines.Curve D2 is a straight line, parallel to curve D1, but plotted to the left.A left pointing arrow indicates the change from D1 to D2.
-Refer to Figure 3.15.Assume that the graphs in this figure represent the demand and supply curves for mustard and that bratwurst and mustard are complements.Which panel describes what happens in this market when the price of bratwurst falls?
Definitions:
Clot
A thickened mass of blood that forms in the circulatory system and is essential for stopping bleeding (hemostasis), but can be harmful if it blocks blood flow.
Nervous System
The network of nerve cells and fibers that transmits nerve impulses between parts of the body, coordinating actions and sensory information.
Octopi
Cephalopod mollusks with eight arms, known for their intelligence, ability to camouflage, and complex behavior.
Intelligent Behavior
Intelligent behavior refers to actions or responses that show an understanding, reasoning, learning, and adaptation to complex situations.
Q1: Most economists believe that labour unions significantly
Q65: Refer to Table 4.16.Consider the data shown
Q79: Refer to Table 4.27.What is the level
Q140: In calculating gross domestic product, Statistics Canada
Q141: Which of the following causes the unemployment
Q169: Suppose the government launches a successful advertising
Q197: Refer to Table 4.12.Consider the data shown
Q248: Discuss the likely impact of each of
Q276: The labour force participation rate is defined
Q283: In November 2015 the Purchasing Managers' Index