Figure 3.15 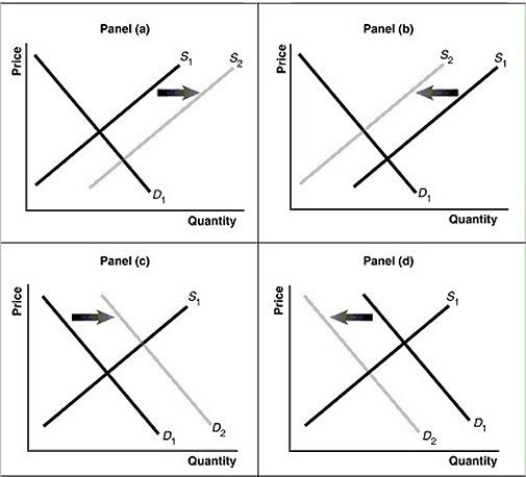 Alt text for Figure 3.15a: In figure 3.15a, a graph of intersecting demand and supply curves represents a rising supply of Blu-ray disc players.
Long description for Figure 3.15a: The x-axis is labelled, Quantity and the y-axis is labelled, as Price.Curve D1 is a straight line which slopes down from the top left corner to the bottom right corner.Curve S1 is a straight line which slopes up from the bottom left to the top right.The point of intersection is at the midpoints of both lines.Curve S2 is a straight line, parallel to curve S1, but plotted to the right.A right pointing arrow indicates the change from S1 to S2.
Alt text for Figure 3.15b: In figure 3.15b, a graph of intersecting demand and supply curves represents a falling supply of Blu-ray players.
Long description for Figure 3.15b: The x-axis is labelled, Quantity and the y-axis is labelled, as Price.Curve D1 is a straight line which slopes down from the top left corner to the bottom right corner.Curve S1 is a straight line which slopes up from the bottom left to the top right.The point of intersection is at the midpoints of both lines.Curve S2 is a straight line, parallel to curve S1, but plotted to the left.A left pointing arrow indicates the change from S1 to S2.
Alt text for Figure 3.15c: In figure 3.15c, a graph of intersecting demand and supply curves represents a rising demand for Blu-ray players.
Long description for Figure 3.15c: The x-axis is labelled, Quantity and the y-axis is labelled, as Price.Curve D1 is a straight line which slopes down from the top left corner to the bottom right corner.Curve S1 is a straight line which slopes up from the bottom left to the top right.The point of intersection is at the midpoints of both lines.Curve D2 is a straight line, parallel to curve D1, but plotted to the right.A right pointing arrow indicates the change from D1 to D2.
Alt text for Figure 3.15d: In figure 3.15d, a graph of intersecting demand and supply curves represents a falling demand for Blu-ray disc players.
Long description for Figure 3.15d: The x-axis is labelled, Quantity and the y-axis is labelled, as Price.Curve D1 is a straight line which slopes down from the top left corner to the bottom right corner.Curve S1 is a straight line which slopes up from the bottom left to the top right.The point of intersection is at the midpoints of both lines.Curve D2 is a straight line, parallel to curve D1, but plotted to the left.A left pointing arrow indicates the change from D1 to D2.
-Refer to Figure 3.15.Assume that the graphs in this figure represent the demand and supply curves for coffee.Which panel describes what happens in this market if buyers expect the price of coffee to rise?
Definitions:
Quad-Core Processor
A central processing unit (CPU) with four independent cores that can read and execute instructions.
Permanent Storage
Permanent storage refers to non-volatile storage media where data is retained even when power is turned off, such as hard drives, SSDs, and ROM.
CPU Usage Levels
A measure of how much processing power is being used by the central processing unit(s) of a computer.
Recycling Programs
Initiatives designed to process materials to make them suitable for reuse, with the aim of reducing waste and environmental impact.
Q6: If consumers believe the price of iPads
Q54: The supply curve for watches<br>A)shows the supply
Q116: In the first half of 2015, the
Q145: A student comments to his roommate that
Q164: Someone who is available for work but
Q182: How does the increasing use of digital
Q183: The GDP deflator is equal to<br>A)real GDP
Q185: The underground economy can be described as<br>A)production
Q284: Which of the following statements is true
Q289: Which of the following price indices comes