Figure 3.15 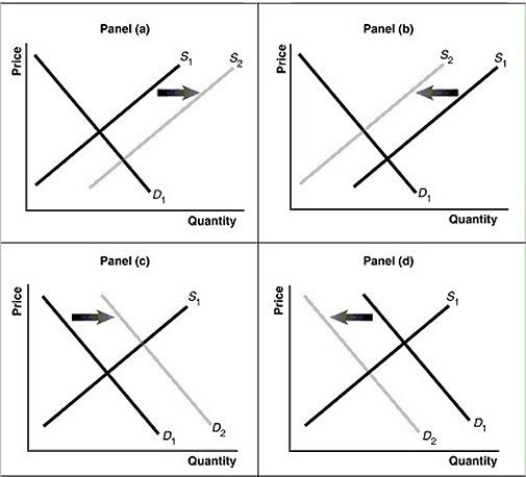 Alt text for Figure 3.15a: In figure 3.15a, a graph of intersecting demand and supply curves represents a rising supply of Blu-ray disc players.
Long description for Figure 3.15a: The x-axis is labelled, Quantity and the y-axis is labelled, as Price.Curve D1 is a straight line which slopes down from the top left corner to the bottom right corner.Curve S1 is a straight line which slopes up from the bottom left to the top right.The point of intersection is at the midpoints of both lines.Curve S2 is a straight line, parallel to curve S1, but plotted to the right.A right pointing arrow indicates the change from S1 to S2.
Alt text for Figure 3.15b: In figure 3.15b, a graph of intersecting demand and supply curves represents a falling supply of Blu-ray players.
Long description for Figure 3.15b: The x-axis is labelled, Quantity and the y-axis is labelled, as Price.Curve D1 is a straight line which slopes down from the top left corner to the bottom right corner.Curve S1 is a straight line which slopes up from the bottom left to the top right.The point of intersection is at the midpoints of both lines.Curve S2 is a straight line, parallel to curve S1, but plotted to the left.A left pointing arrow indicates the change from S1 to S2.
Alt text for Figure 3.15c: In figure 3.15c, a graph of intersecting demand and supply curves represents a rising demand for Blu-ray players.
Long description for Figure 3.15c: The x-axis is labelled, Quantity and the y-axis is labelled, as Price.Curve D1 is a straight line which slopes down from the top left corner to the bottom right corner.Curve S1 is a straight line which slopes up from the bottom left to the top right.The point of intersection is at the midpoints of both lines.Curve D2 is a straight line, parallel to curve D1, but plotted to the right.A right pointing arrow indicates the change from D1 to D2.
Alt text for Figure 3.15d: In figure 3.15d, a graph of intersecting demand and supply curves represents a falling demand for Blu-ray disc players.
Long description for Figure 3.15d: The x-axis is labelled, Quantity and the y-axis is labelled, as Price.Curve D1 is a straight line which slopes down from the top left corner to the bottom right corner.Curve S1 is a straight line which slopes up from the bottom left to the top right.The point of intersection is at the midpoints of both lines.Curve D2 is a straight line, parallel to curve D1, but plotted to the left.A left pointing arrow indicates the change from D1 to D2.
-Refer to Figure 3.15.Assume that the graphs in this figure represent the demand and supply curves for ramen noodles, an inferior good.Which panel describes what happens in this market as a result of an increase in income?
Definitions:
Cerebral Commissures
Bundles of nerve fibers in the brain that connect the two cerebral hemispheres, allowing for communication between them.
Receptor Cells
Cells in the body that respond to specific stimuli like light or chemicals and transmit signals to other cells.
Primary Receptors
Sensory cells or nerve endings that initiate the process of sensation by detecting external stimuli and converting them into electrical signals for the nervous system.
Secondary Receptors
Protein molecules located on cell surfaces or within cells that bind to external signaling molecules after they have interacted with primary receptors, often amplifying the cellular response.
Q120: To increase fuel efficiency, automobile manufacturers make
Q141: As incomes in Alberta fall people are
Q142: Refer to Figure 2.16.One segment of the
Q147: Which of the following statements about a
Q167: The values of real GDP and real
Q215: If property rights are not well enforced,
Q250: In comparing China to the United Kingdom,
Q260: Which of the following is an example
Q274: Which of the following transactions would take
Q283: The basis for trade is comparative advantage,